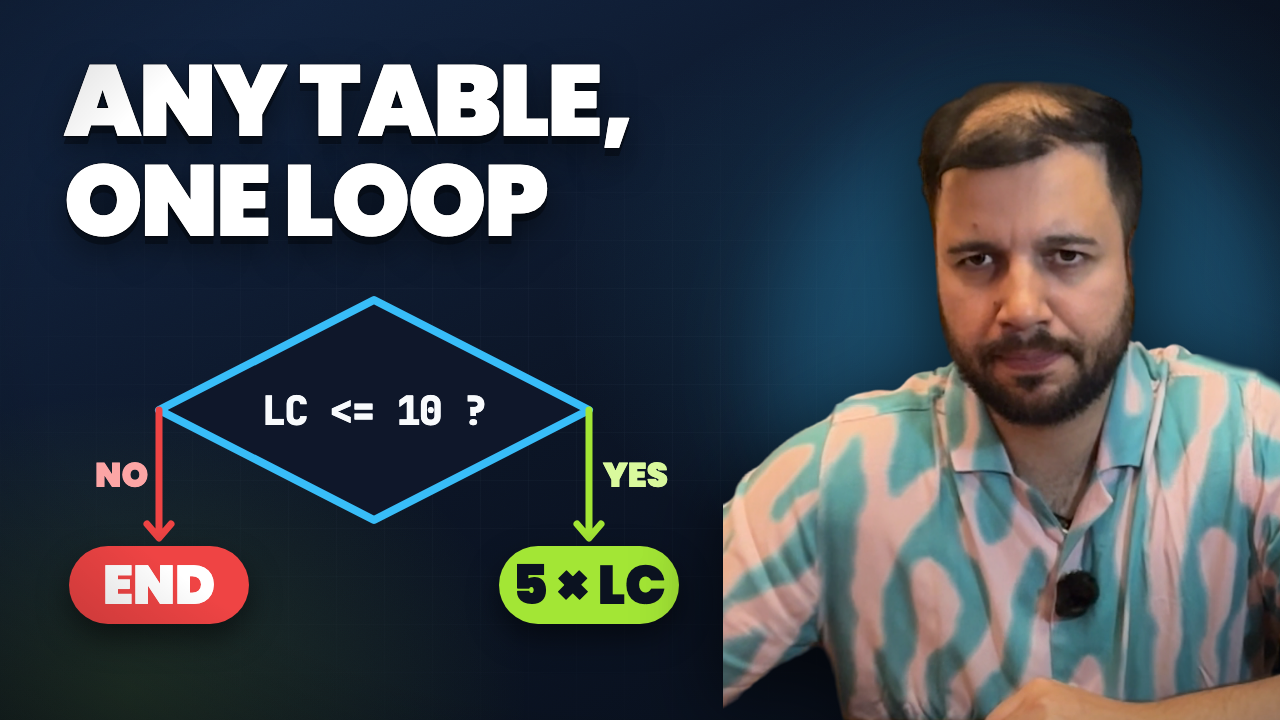
Any number the user enters, multiplied × 1 to × 10 by a loop: spot the loop, draw the flowchart, and trace the table of 5 by hand
Printing a times table is one of the first problems where a loop really pays off. In this lesson we build a multiplication table flowchart: the user enters any number, and the flowchart prints its table from × 1 to × 10.
The real skill is not the table itself. It is learning to look at a problem and see what repeats and what changes, because that is exactly where a loop goes.
The problem: print any number’s table
If the user enters 5, the program should print:
5 x 1 = 5
5 x 2 = 10
...
5 x 10 = 50
If the user enters 7, it prints 7’s table; 8 gives 8’s table, and so on. The number can be anything.
Spot the loop: what changes and what stays
Look at the lines above. The multiplier runs 1, 2, 3 … 10 on every line: that part repeats in a fixed range, so it becomes the loop counter (LC).
The number stays the same on every line, but the user decides it. So the flowchart needs two values: the number (an input) and the loop counter (1 to 10).
The multiplication table flowchart, step by step
- Start.
- Input number (for example 5).
- LC = 1: initialise the loop counter.
- LC <= 10? (decision): the loop runs while this is true.
- Yes: print number × LC (for example “5 x 1 = 5”), then LC = LC + 1, and the arrow goes back to the decision.
- No: End.
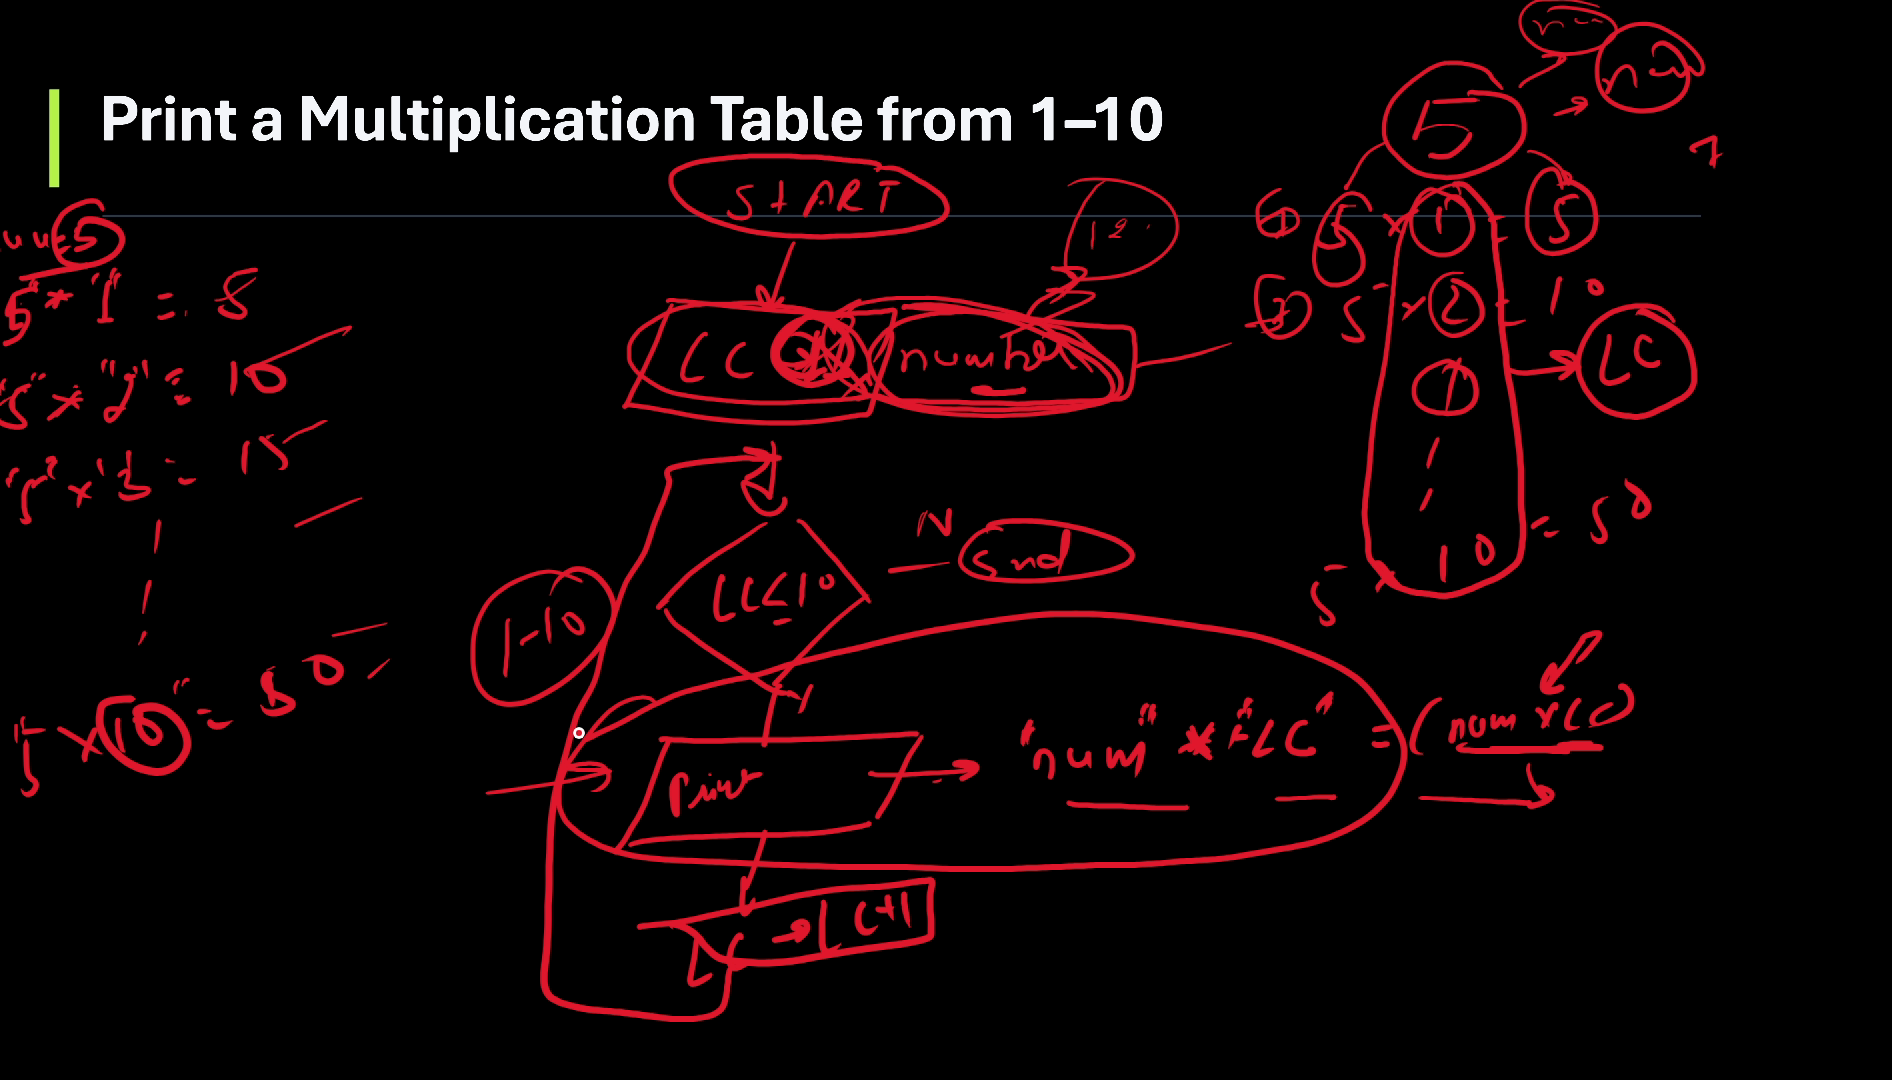
The text “5 x 1 =” is printed as it is, and the product is calculated and printed after it.
Trace it by hand with 5
| LC | LC <= 10? | Output | |—|—|—| | 1 | Yes | 5 x 1 = 5 | | 2 | Yes | 5 x 2 = 10 | | 3 | Yes | 5 x 3 = 15 | | … | … | … | | 10 | Yes | 5 x 10 = 50 | | 11 | No | (End) |
The print step runs 10 times. When LC reaches 11, the condition is false and the loop ends.
Any number works
Nothing in the flowchart depends on 5. Enter 125, and the same steps print 125 x 1 = 125, 125 x 2 = 250, all the way to 125 x 10 = 1250. One loop replaces ten handwritten lines, for every possible number.
Why the flowchart comes first
Once you can draw this flowchart, writing the code is mostly translation: the decision becomes a loop condition, the box LC = LC + 1 becomes the update, and the print box becomes one output line. Understand the problem and the logic first, and the code is not the hard part.
Video chapters
- 0:00 A loop practice problem
- 0:18 The task: any number's table, × 1 to × 10
- 0:53 Spotting the loop: what changes
- 1:20 Drawing the flowchart
- 2:01 Two inputs: number and loop counter
- 2:34 Printing number × loop counter
- 3:15 Testing it with 5
- 4:36 Any number works: even 125
- 5:09 Why a flowchart makes code easy
Watch the short versions
Short on time? These Shorts from this lesson each make one point in under a minute.
- Spot the Loop: Any Number’s Times Table (48 s Short, coming soon, from 0:18 in the full video)
- Table of 5 with a Loop: Trace It by Hand (55 s Short, coming soon, from 3:28 in the full video)
- Flowchart First, Then Code (26 s Short, coming soon, from 5:17 in the full video)
Key takeaways
- Look for what repeats in a fixed range: that becomes the loop counter.
- Values the user decides are inputs, not part of the loop.
- Multiplication table flowchart: input number, LC = 1, LC <= 10?, print number × LC, LC = LC + 1, End.
- The loop ends when LC reaches 11.
- The same flowchart prints the table of any number.
Frequently asked questions
How do you draw a flowchart for a multiplication table?
Start, input the number, set LC = 1, check LC <= 10; if yes, print number × LC, add 1 to LC and go back to the check; if no, end.
Why is the loop counter 1 to 10?
A times table multiplies the number by 1, 2, 3 … 10. That fixed, repeating range is exactly what a loop counter models.
How do I print the table up to 20?
Change the condition to LC <= 20. Nothing else in the flowchart needs to change.
Further reading
- Flowchart to output the multiplication table of n (Educative): the same exercise as a flowchart
- Iteration statements: the for statement (Microsoft Learn, C#): how the loop becomes code later
Practice: change the flowchart so it prints the table up to 20, then trace it with 3. What changes: the input, the condition or the update?
If you want to learn programming from zero, watch the video, subscribe to the channel and follow the series.